The Registration Trends component helps agency users (with the View participant data permission) to monitor how the number of event registrations varies with two tabs:
Note: Registration counts include Pre-Paid Invites, All payment plan registrations(suspended/pending), and charge back registrations.
1. Registrations tab
- A configurable registration Goal
- Note: Once it's configured, it only can be adjusted, cannot be removed.
- The event's registration Capacity (maximum number of registrations)
- The number of registrations received Yesterday and Today
- The number of registration Cancellations
- The number of registrations with Transferred categories
- The number of registrations with Unsigned waivers
Agency users can view the registration data of a specific Category, Price type in a Date range by clicking the  filter icon
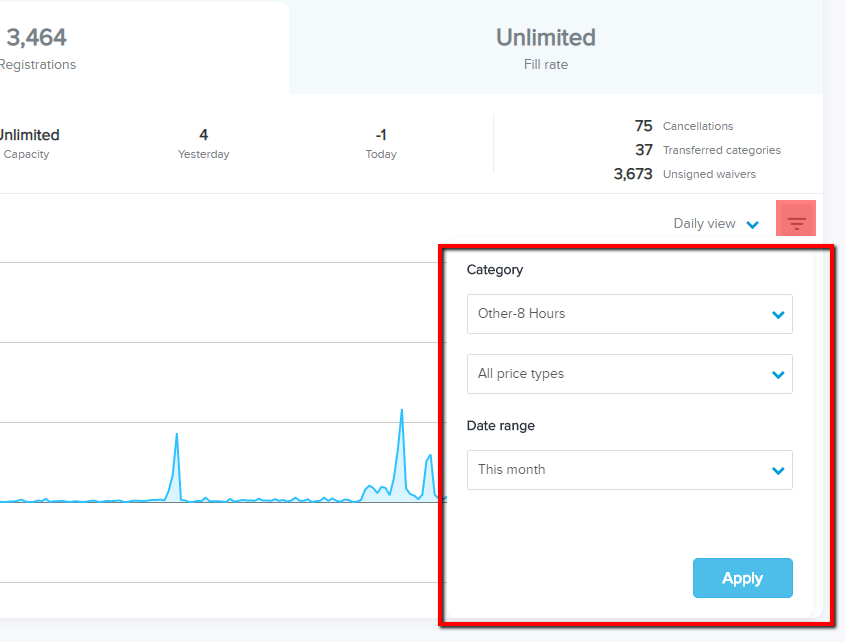
- Note: Custom date can be configured to display data between specified start and end dates.
- The top of this tab displays the total number of registrations of selected Category, Price type in the selected Date range.
- The line chart displays the number of registrations in each time interval in the selected Date range. Agency users can select the required time interval (Daily view, Weekly view or Monthly view) from the drop-down menu.
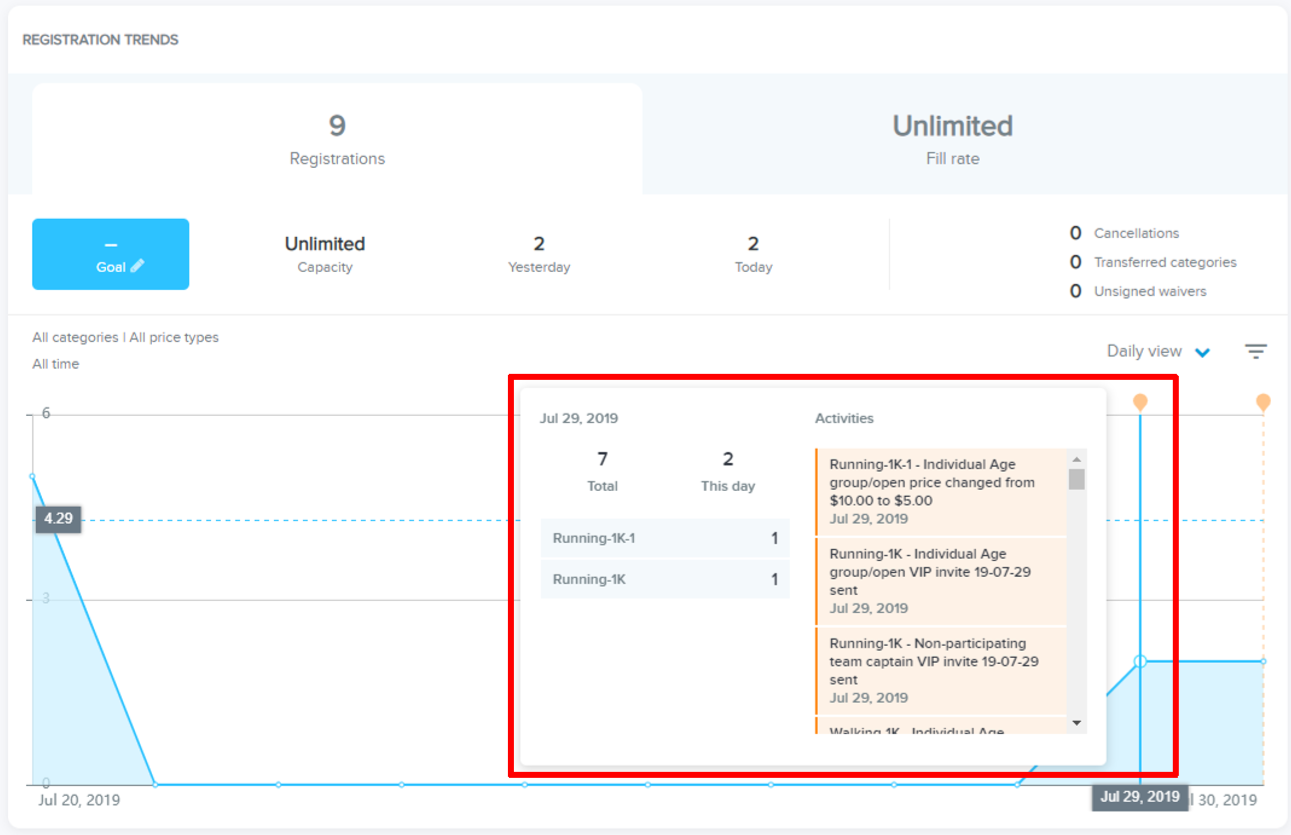
- Hover the cursor over a point on the chart to display a tooltip showing:
- Cumulative Total number of registrations as of that day/week/month.
- Number of registrations on that day or in that week/month
- Number of registrations in each category in that day/week/month (Categories with zero registrations are not listed)
- Dates and details of marketing activities in the corresponding day / week / month. Including following marketing activities:
- Price-category registration opened / closed
- Price changes (including manual, time-based and volume-based price changes)
- VIP invite email sent
- Event associated marketing email sent
- Social referral campaign launched / rebate paid
- If an event level capacity is configured, the overall fill rate will show up on the top of this tab. (Logic: Registrations / event level Capacity*100)
- A list of event CATEGORY/ PRICE TYPE is displayed with:
- Fill rate bar chart and percentage (Logic: REGISTERED / CAPACITY *100)
- Category / price type level CAPACITY
- Number of REGISTERED participants and fill rate (Logic: REGISTERED / CAPACITY *100)
- Remaining number of AVAILABLE spots and percentage (Logic: AVAILABLE / CAPACITY *100)
Agency users can also compare the performance of the current event against up to two other events (for which the user has permission) by clicking the

(Compare) icon and then selecting the required events:
In the Comparison view, the registration trend lines for the events are superimposed on a single chart. As the dates of the events do not generally overlap, the component automatically aligns the first registration month of the events and presents a month-by-month comparison of registration trend.
To check the registration data details, agency users can:
- Hover the cursor over the event name to check the full event name.
- Hover the cursor over a point on the line chart to display the corresponding event names, months/years and number of registrations in that month for each of the events.
- Click-and-drag the two range controls below the line chart to change the displayed date range (the minimum displayable date range is one month).
- Hover the cursor over the corresponding event date range at the bottom to highlight the event's line in the chart.
- Click the corresponding event data range at the bottom to toggle the event's line between visible and hidden in the chart.
- Click Exit button to exit comparison view.
Last Updated: 12/16/2025